At Creekmur Wealth Advisors we have had the unique opportunity over the last 30 years to partner with thousands of families from around the country and help them achieve their goals and dreams. There is nothing more rewarding than working with a client for years, or even decades, and seeing how these individuals use the tool that is money to live out their ideal lifestyle.
Over the years, we have found a wide disparity of outcomes between those that utilize a true financial plan and those that do not. Those with a plan can navigate the market or economic storms that will inevitably come and have peace of mind throughout that difficult time. Those without a plan often struggle to make the right decision or end up making an emotional decision that is not based on data that ultimately hurts them. Those with a plan usually end up achieving their primary goal and then have the resources to pursue other passions or dreams that they have. Those without a plan frequently don’t recognize how much potential their finances could afford them.
I recently came across a study from Cerulli Associates that dove into this very topic:
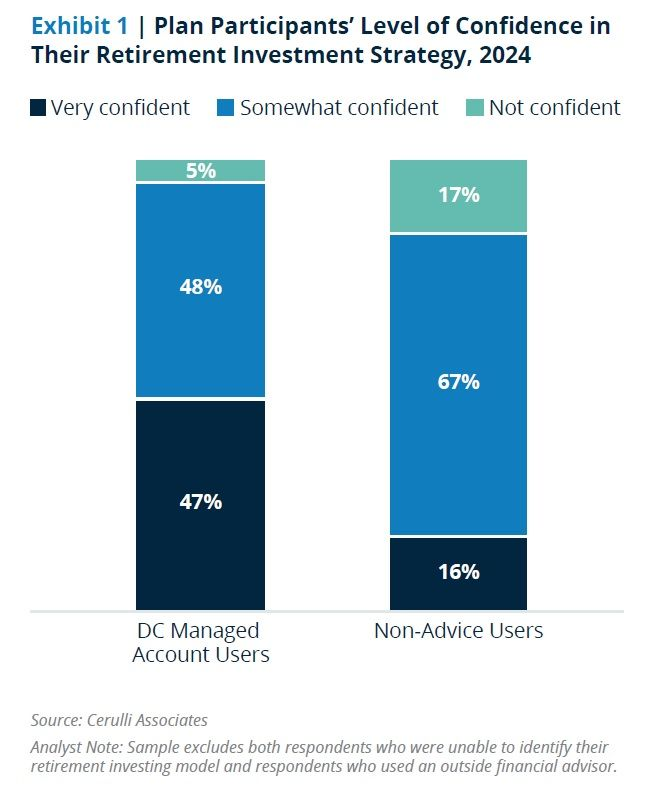
These results somewhat surprised me at first, but after taking some time to consider our own experience working with clients, these results actually appeared to be quite accurate. Whether you are building a home, taking a vacation, or planning for your financial future having a clearly defined goal and structured plan to help you achieve that goal ensures that you can proceed with confidence and peace of mind. There will always be another market crash, economic recession, or even drastic changes in one’s personal life. Our desire at Creekmur Wealth is to ensure that our clients do not have to worry about money during any of those challenging moments. That is why we have created the Retirement Blueprint.
The Retirement Blueprint is a customized retirement plan that seeks to ensure that the four pillars of your retirement – Income, Investments, Taxes, and Legacy - have a clearly defined plan in place to address each risk that could stand in the way of you achieving your goals. The below link goes into greater detail on the exact planning work that goes into building each of these pillars:
CWA Blueprint ProcessWhenever a Blueprint is completed that does not mean the work stops. One constant in our world is change, and as change occurs your Blueprint needs to evolve with it. That is why we meet with our clients throughout the year to review progress towards their goals and address any changes in the world around us, whether that be a market, tax, or lifestage change. Below are a couple of conversations that our Founder & CEO John Creekmur had with our clients regarding how life changes can lead to a need to evolve your Retirement Blueprint:
Studies have shown that the vast majority of Americans do not have a written retirement plan. Which is why our team of qualified and credentialed professionals live every day striving to help ensure that no individual or family is without a plan. If you do not have a retirement income plan, or maybe have concerns about your current plan, I would strongly encourage you to reach out to our team. Our advisors and CFP Professionals are standing by to help you achieve your goals and dreams.

The information presented is not investment advice - it is for educational purposes only and is not an offer or solicitation for the sale or purchase of any securities or investment advisory services. Investments involve risk and are not guaranteed. Be sure to consult with a qualified financial adviser when making investment decisions.