


Will this current Stock Market Rally continue?
First of all, as with everything market related over the last few months – anything could happen and we would not be surprised! There is no historical precedent for current events to aid in determining what the future holds with the stock market. But we can make some observations:
From February 20 to March 23 the S&P 500 dropped by 33.67%. Then, rose by 28.48% from March 23 to April 17. This V-shaped market bounce was largely unrelated to the economic and medical news occurring at the same time. So, where does the market go from here?
- Near Term Volatility – We use a technical indicator called Bollinger Bands to help us analyze where the market may move in the coming days or weeks. Bollinger Bands track the upper and lower Standard Deviation level of the Moving Average Price of a Security. In plain English, this simply means that you can see how undervalued or overvalued a security or the market as a whole is. Historically, if the price of the security touches the top or bottom of the Bollinger Bands you will see a movement in the opposite direction in short order. Take a look at the chart below of the S&P 500 over the past year:
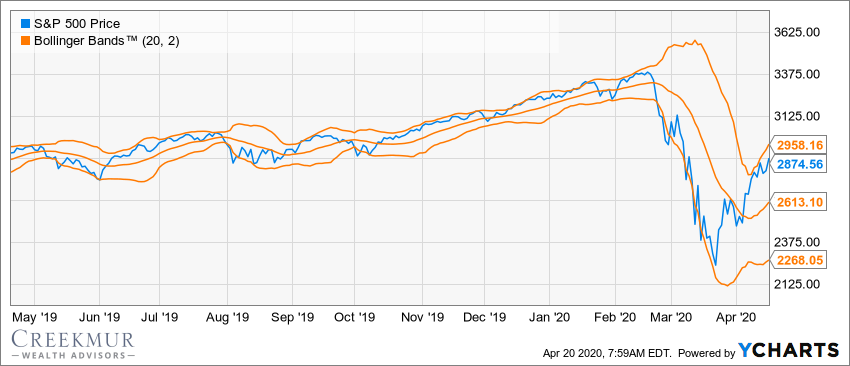
From the middle of February to the middle of March the S&P 500 was touching the lower Bollinger Band – this told us that we were bound for a sharp bounce of the S&P 500 soon. Now that the bounce has occurred, the S&P 500 is almost touching the upper Bollinger Band level which traditionally is an indicator of some near-term negative market movement.
- Long-Term Growth With A Solid Financial Plan – As long-term investors many of you have experienced some form of short-term market drop. If you have been able to withstand the urge to pull your funds from the market and rather continue to invest through the volatility you have quite possibly seen appreciation in your accounts. Here is a nice reminder of what the S&P 500 has done since January 1, 1980:
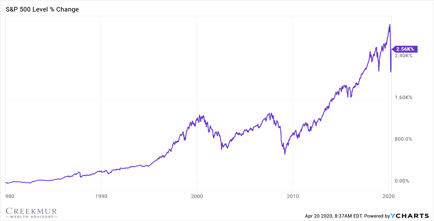
During major stock market volatility, it is key to remind yourself of where you started, how far you have come, and your long-term goals. The above chart reminds us that a well-designed financial plan and long-term focus are two of your best allies in weathering financial storms.
Creekmur Wealth Advisors may be reached at 866-358-4441 or Info@Creekmurwealth.com.

Citations.
1 - kiplinger.com/slideshow/investing/T018-S001-25-dividend-stocks-analysts-love-the-most-2019/index.html [3/10/2020]
2 - marketwatch.com/story/the-dow-just-tumbled-into-a-bear-market-ending-the-longest-bull-market-run-in-historyheres-how-those-downturns-last-on-average-2020-03-11 [3/14/2020]
